Key Takeaways:
The candidate-to-job ratio is 13 to 1, growing from 9 to 1 at the beginning of the quarter. Job search is getting even tougher.
New job listings have decreased by 25%, while hires are down by 7% compared to the previous quarter.
Salaries for tech professionals have seen a decrease of $200-500 compared to the previous year, with the exception of top-level experts.
Marketing remains the dominant job category, receiving the most attention from recruiters.
The number of applications per job has nearly doubled in a year, with an average of 25 applications per job in September.
For every 100 applications, candidates receive 21 proposals. The Djinni index is gradually growing for the second consecutive month.
Candidates are showing more loyalty to their current positions, with the average time between hires increasing by 40%.
The gap between candidates and online job opportunities is widening
As of the beginning of October, there are 92,3K candidates available on Djinni (a 5% increase compared to the previous quarter) and 7K jobs online (a 25% decrease from the last quarter* ). Consequently, competition across all categories has significantly intensified, rising from 9.15 to 13 over the course of three months.
*Note: The decline in job listings is most likely due to Djinni's introduction of a new pricing policy in August 2023. Specifically, we have reduced the cost of hiring candidates from Ukraine. However, it's no longer free to hire a candidate if they applied first. Hiring for junior positions is still free.
New candidate profiles outnumber job vacancies by nearly two to one
Nearly 19K candidates initiated their job search on Djinni in September, while recruiters posted approximately 10K jobs.
Starting from November 2022, there has been a consistent trend of more new candidates activating their profiles on the platform each month than the number of fresh job listings. Up until August, companies were regularly publishing 14-15K job openings each month. However, following the introduction of new pricing, this figure has dropped to 10K. On the other hand, the number of candidates creating and publishing their profiles has remained relatively stable, ranging from 19K to 20K monthly.
Quarterly hires down 7%
On Djinni, candidates have the option to report if they were hired after a contact made through the platform, and companies confirm these reports. During the third quarter of 2023, approximately 2,7K hires were reported. This number is slightly lower than in the previous quarter.
July stood out as the most successful month, with 1130 hires, while the remaining two months saw fewer than a thousand hires each.
The share of developers in hires is a stable 44% over the last year, other tech candidates (DevOps, QAs, etc.) comprise 35%, and the rest, about 21%, are non-tech hires.
.NET and Python developers gain traction in new hires
The share of .NET and Python categories is higher than before, while JavaScript continues to lead the pack. Despite the fall in most other categories, the hiring of front-end developers has remained consistent from the last quarter.
The top categories for new hires this quarter are JavaScript (15%), QA (8%), Project Manager (6%), .NET (5.5%), and Marketing (5%).
In the third quarter, the share of .NET developers in new hires increased from 3.5% to 5.5%. This category rose from 9th to 3rd position in just one quarter. Python's popularity has been steadily growing over the past year, moving from the 10th position at the end of 2022 to the 7th position in Q3 2023.
Conversely, PHP dropped from the 5th position to the 10th, and the demand for Design candidates also decreased, moving from the 3rd position to the 6th.
Approximately 36% of the hired candidates have over 5 years of experience, which remains consistent with the previous quarter. Candidates without commercial experience comprise only 11% of new hires, slightly higher than the previous quarter.
Salaries for most tech professionals down by $200-500
On average, monthly salaries for middle-senior tech professionals have decreased by $200-500 compared to the third quarter of the previous year, with the most significant impact seen among professionals with 3-6 years of experience. Salaries for trainees have remained unchanged ($500), as well as for top-level experts with 7+ years of experience ($5000 net/monthly).
The monthly dynamics reveal a notable decline in salaries for top-level experts in June and July 2023. However, the trend experienced a rebound in September.
Looking across categories, salaries for candidates with 2+ years of experience in Java, .NET, PHP, and JavaScript have remained stable. Python and Node.js developers have seen a slight decrease in salaries for hired candidates. The only two categories that have witnessed an increase in salaries are DevOps and Support.
Salaries and Experience Shifts in Key Roles
We analyzed the salaries and experience of tech specialists hired over the past two years, from September to August. Currently, data engineers are being hired with less experience but at higher salaries. Java programmer hires now have nearly a year more experience on average, with a $400 salary increase. Team Lead positions saw the largest salary jump, with a $600 rise and just a 3-month increase in experience.
On average, the experience of hired candidates falls in the range of 3-5 years, except for Team Leads, where it's 9-10 years, and Lead Generation specialists, who have an average experience of 1-2 years.
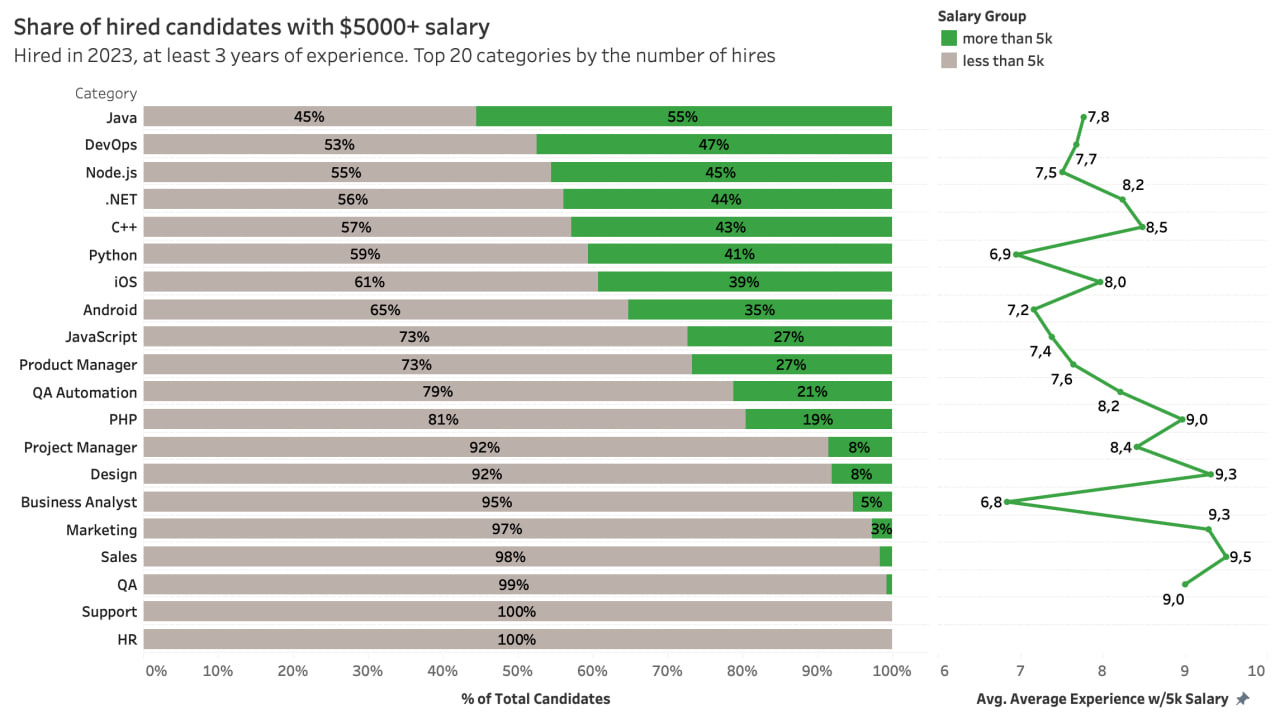
More than half of Java programmers with 3+ years of experience earn over $5000
Java developers are the most likely to receive a salary higher than $5K.
DevOps follows closely, with 47% of practitioners breaking the $5000 barrier. Node.js developers secured the third spot, boasting a substantial 45%. Only 1% of Manual QAs can anticipate such figures, and Support and HR roles have yet to experience these salary levels in 2023.
PHP programmers face the longest journey among developers, with 9 years of experience required to reach these salary levels. They also represent the smallest proportion of high earners, comprising just 19%.
New job postings down 22% since last quarter. Jobs for trainees and switchers remain stable
In Q3 2023, recruiters posted 22K new jobs, marking a 22% decrease from the previous quarter and a 25% decrease year over year.
The most substantial drop was observed in jobs that require at least 3 years of experience, while job openings for trainees and career switchers remained stable. However, it's worth noting that a majority of job opportunities for candidates without experience are in Lead Generation, Sales, and Support roles.
The number of job vacancies has decreased across almost all categories. This is most noticeable in the Data Engineer, Salesforce, Unity, Rust, and C++ categories, which have seen declines ranging from 35% to 45%. The only two categories that have experienced an increase in the number of jobs are Lead Generation and Recruiter, with a 4-5% growth.
Marketing maintains its position as the dominant category for the second consecutive quarter
In the previous quarter, Marketing overtook JavaScript as the leading category for the first time since 2019. In Q3, it continues to hold this position with 2,536 job listings (a 9% decrease from the last quarter), while frontend positions total 1,709 (a 30% decrease).
QA positions, which were highly sought after in 2021 (Manual QA ranked as the third most popular category after JavaScript and Java), have faced a dramatic decline, with Manual QA now ranking 12th and QA Automation dropping to 13th place.
Sales category is now third, surpassing DevOps, PHP, and Java in popularity.
The share of office-based jobs has increased from 7% to 9%, while the share of candidate's choice options has decreased from 38% to 35% over the last three months. In Q3 2022 office presence was required in only 5% of job openings.
Candidates send almost 5 times more job applications than receive proposals
The monthly number of job applications has been gradually slowing down since reaching a record-breaking 337K in July. This decline correlates with the decrease in available job listings online.
In September, recruiters initiated contact with candidates on Djinni a total of 59,8K times. This represents a slight 2% decrease in proposals compared to August and marks the lowest number since the pandemic.
A total of 35,8K candidates sent applications in September, which is 200 fewer than the previous month and about one third of candidates online. Almost half of the candidates who sent applications, applied to three or fewer jobs. Only 22% of applicants were interested in 10 or more vacancies.
Applications per job doubled in a year
On average, a single job received 24.6 applications in September. It appears that the trend of applications per job has a negative correlation with the number of available job listings for candidates to apply to.
The job market is particularly challenging for QA specialists, irrespective of their level of experience. On average, jobs in this category receive nearly 77 applications each. However, this is no longer the most competitive category for newcomers entering the IT field. Creative categories like Designers tend to have a higher number of applications per job for positions that require no prior experience.
Number of applications per job for trainees does not change much over the year. However, jobs that require at least three years of experience are becoming more and more competitive.
Five most competitive categories regardless of experience are Manual QA, JavaScript, Design, Recruiter and Project Manager.
Recruiters answer to about one third of applications
Due to the large number of applications, recruiters do not have time to process all of them. Of the September responses, recruiters viewed 61% and responded to only 33%.
Recruiters' responses are not influenced by the quantity of applications a candidate sends, but rather by their category and the competition within it.
For example, Salesforce developers receive responses to nearly 70% of their applications, while Flutter candidates receive responses to only 20%.
The median response rate among Manual QA professionals is 26%, while among frontend developers, it's 25%. Interestingly, senior testers tend to receive fewer responses.
Note: 40% median response rate on the chart is the median across categories, while a median across candidates is about 33%.
For every 100 job applications sent, candidates receive 21 proposals
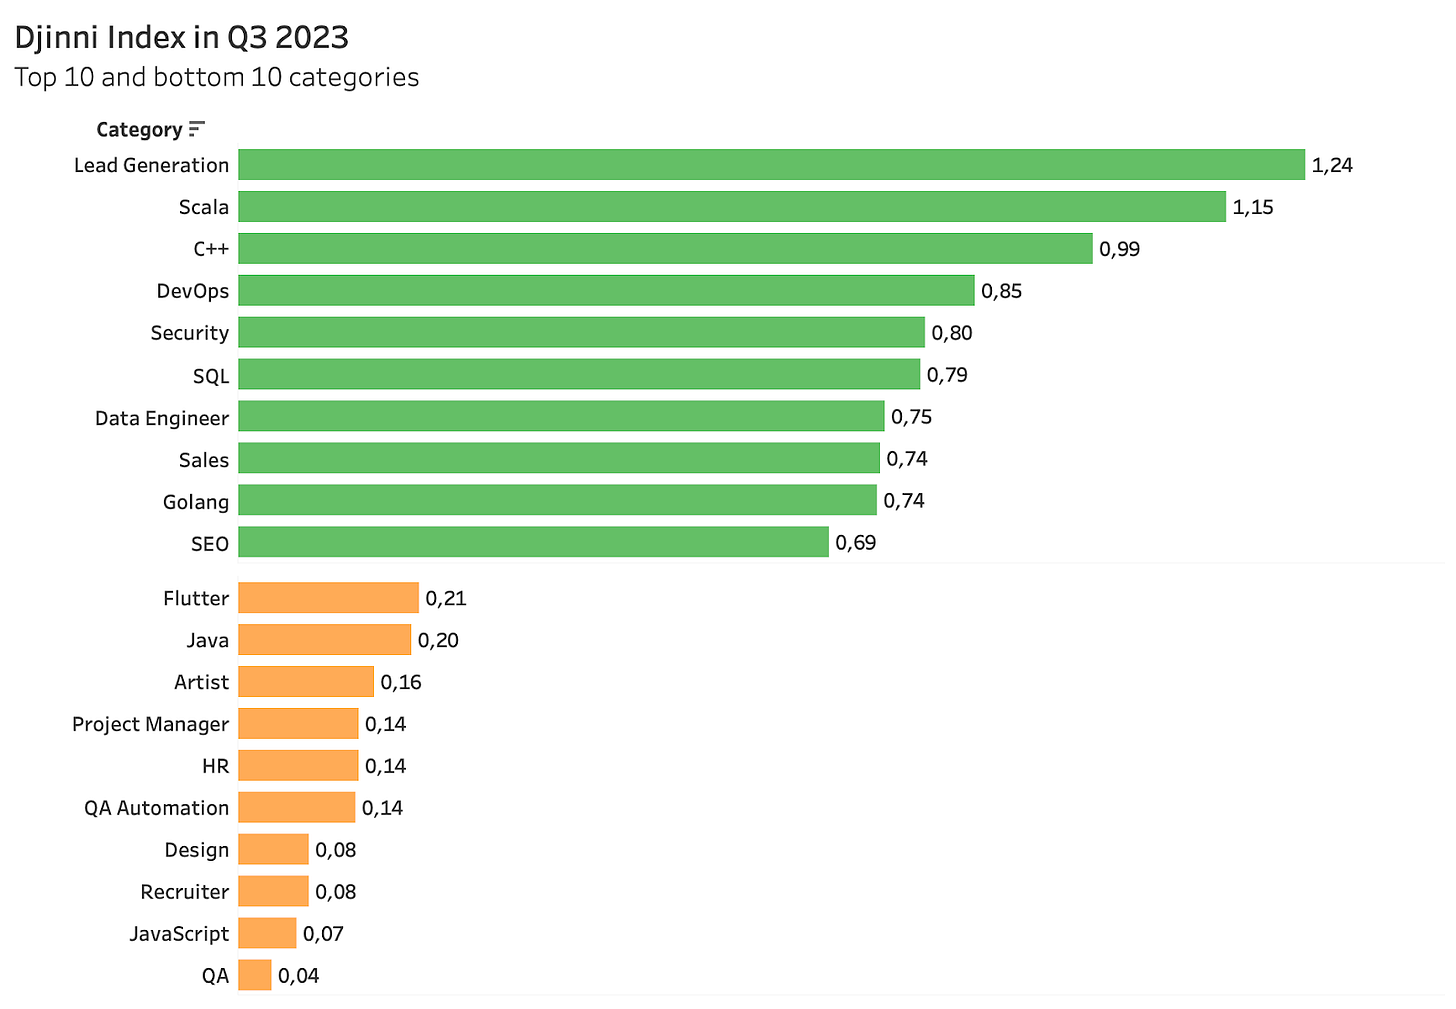
Last quarter we introduced Djinni Index as an indicator of demand for candidates.
Djinni Index is calculated as the number of proposals received by candidates divided by the number of applications sent. An increase in the index indicates a rising demand for candidates. A decrease means that demand from companies is declining and finding work becomes more challenging.
The Djinni index is slowly but steadily growing for the second month in a row. In September it is 0.21, which means that on every hundred of applications, candidates receive 21 proposals from recruiters on average.
The most significant growth is observed in Scala, C++ and Rust categories. Additionally, there has been an increase in messages to System Administrators, Golang, PHP, and Ruby programmers.
Categories that have the Index higher than 1 this quarter are Lead Generation, Scalal and C++ (almost, it’s 0.99). For these categories, recruiters reach out to candidates more often than candidates send applications.
The Index is the lowest for Manual QA, which correlates with their high number of applications per job. These candidates receive only 4 propositions per 100 applications.
Recruiters show more interest in inexperienced candidates
The proportion of recruiters’ propositions received by candidates with no experience has risen from 2% a year ago to 7% in September. Another segment gaining popularity is candidates with 1 or 2 years of experience. Their share of attention has increased from 13% to 20%.
This increase has had minimal impact on developers and QAs, since most of such propositions are targeted towards non-technical candidates, especially those interested in Sales and Lead Generation.
12,5% propositions in September were received by Marketing candidates. JavaScript developers are in second place with almost 10% and Sales professionals come third with 7%. PHP category is still in the 4th position, same as last month, but DevOps slided from 5th to 7th place, outnumbered by Project Managers and Node.js developers.
The average number of job propositions per candidate is 2.01
The average number of propositions per candidate in September dropped from 2.04 to 2.01 with almost 30K candidates receiving such messages.
DevOps receive the most proposals among technical categories, almost three, while QA professionals — only 1.2. Among all technical categories, the average number of proposals per candidate is 1.9. This indicates that candidates in non-technical categories like Marketing receive more messages than tech professionals.
JavaScript category receive the most proposals in total among technical categories. However, there are also many frontend candidates, so their average messages per candidate is only 1.6.
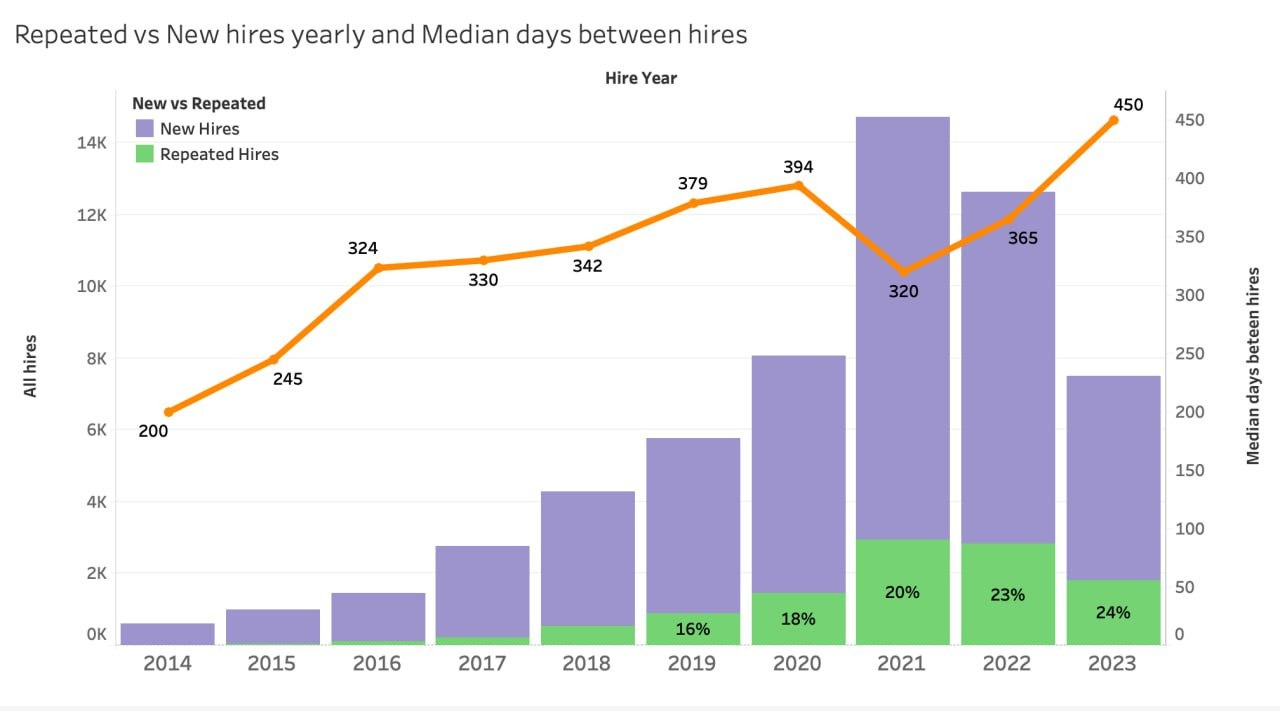
The average time between hiring the same candidate increased from 320 days in 2021 to 450 days in 2023
Over Djinni's 10+ years of existence, 48K candidates were hired for nearly 60K positions. 8394 candidates have been hired more than once. Among them, 80% were hired twice, 15% were hired three times, and only 5% more than that. Four candidates have been hired 10 times since 2013.
Note: Data for 2023 contains only confirmed hires until September
Every year, the percentage of repeat hires grows. Currently, it accounts for almost a quarter (24%), but the growth rate seems to have slowed down.
In 2021, hiring activity soared, nearly doubling that of 2020, while the time gap between hires notably shrank. However, the dynamic changed in 2023, marked by heightened competition, leading candidates to exhibit greater job loyalty.
The salary of Ukrainian senior developers is comparable to those of Germans, but Polish expect more
The median net salary for Ukrainian developers with 5+ years of experience is $5000, which aligns with the earnings in the Czech Republic, Germany, Bulgaria, and Turkey. In Poland or Spain, developers, on average, aim for $5500, while in Portugal or the Netherlands, they seek $6000.
Mid-level developers in Ukraine tend to be more cost-effective compared to their counterparts in other European countries. The median salary for candidates with 2 to 4 years of experience is $2200, a figure that is only matched in Hungary. In the rest of Europe, this category generally demands at least $2500.
Note: Djinni asks candidates to mention their minimal desired monthly net salary in their profile. These are the salaries of candidates online on Djinni.
You can explore the map, select your experience level and category here.
Conclusions
The competitiveness of the IT job market is on the rise, marked by a surge in job applications per position and a decline in salaries. The sustained demand for Marketing and Sales roles suggests that IT companies are still grappling with client acquisition, resulting in fewer job openings. Nevertheless, the gradual uptick in the Djinni Index indicates that recruiters are increasingly reaching out to promising candidates. On a positive note, employees are exhibiting greater job loyalty, with extended periods between job changes.
While this quarter may not have been the best Djinni has seen, it certainly wasn't the worst. We take pride in the fact that foreign companies are opting to hire Ukrainian developers in these turbulent times, prompting us to reduce hiring costs for them. However, this new pricing structure can complicate the assessment of the market's true dynamics, as some Ukrainian companies are adjusting to the fact that Djinni is not completely free now.
Nonetheless, Djinni remains committed to providing recruiters and candidates with new features to streamline their search for the perfect match.
We are expecting more activity in autumn since this is the hottest recruitment season.
Follow us on LinkedIn for more news and market updates.


Does Jinni have by now statistically significant number of candidate profiles in Germany and other countries to create proper market analysis? My Senior developer friends in Germany and the Netherlands report different salaries. Though they may be well beyond median.
What do you think?
Thanks a lot for your impressive analytics, I really liked it.
P.S. I have one idea - how can I share it with you?:)